In the study of thermodynamics, understanding the behavior of pure substances under various conditions is fundamental to numerous engineering applications. One of the most comprehensive and insightful ways to visualize this behavior is through the Pressure-Volume-Temperature (P-V-T) surface, which provides a complete three-dimensional representation of all possible states a pure substance can exist in. This powerful conceptual tool allows engineers and scientists to understand phase transitions, critical points, and the relationships between different thermodynamic properties in a way that two-dimensional diagrams cannot fully capture.
The P-V-T surface is particularly important in thermal engineering and power unit design, where accurate knowledge of substance behavior is crucial for the efficient operation of systems such as steam power plants, refrigeration cycles, and internal combustion engines. By examining this three-dimensional representation, engineers can gain insights into how substances behave under extreme conditions and how to optimize system performance across different operating ranges.
Introduction to Pure Substance States
To understand the P-V-T surface, we must first establish what constitutes a pure substance and how its state is defined. A pure substance is one that has a fixed chemical composition throughout its mass, such as water, nitrogen, or carbon dioxide. The state of a pure substance can be completely defined by specifying just two independent intensive properties, since all other properties are then determined by the equation of state.
The three most commonly used intensive properties for describing the state of a pure substance are:
- Pressure (P): The normal force exerted by the substance per unit area
- Specific Volume (v): The volume occupied by a unit mass of the substance
- Temperature (T): A measure of the average kinetic energy of the molecules
Since only two of these properties are independent, we can express any one of them as a function of the other two. This relationship forms the mathematical basis for the P-V-T surface:
This equation of state represents a surface in three-dimensional space, where each point on the surface corresponds to an equilibrium state of the pure substance.
Two-Dimensional Projections (Phase Diagrams)
While the complete P-V-T surface provides the most comprehensive view of a substance’s behavior, it is often more practical to work with two-dimensional projections that highlight specific aspects of the thermodynamic behavior. These projections, commonly known as phase diagrams, are slices through the three-dimensional surface and provide valuable insights into particular regions of interest.
P-v Diagram (Pressure-Specific Volume)
The P-v diagram is one of the most frequently used projections in engineering thermodynamics. It plots pressure against specific volume at constant temperature and clearly shows the vapor dome, which represents the boundary between liquid and vapor phases.
Key features of the P-v diagram include:
- Vapor Dome: The curved region that separates the liquid and vapor phases, with the left boundary representing saturated liquid states and the right boundary representing saturated vapor states
- Critical Point: The point at the top of the vapor dome where the properties of saturated liquid and saturated vapor become identical
- Saturated Liquid Line: The left boundary of the vapor dome, representing states where the substance is entirely liquid but at the point of vaporization
- Saturated Vapor Line: The right boundary of the vapor dome, representing states where the substance is entirely vapor but at the point of condensation
- Superheated Vapor Region: The area to the right of the saturated vapor line, where the substance exists entirely as vapor at temperatures above the saturation temperature
- Compressed Liquid Region: The area to the left of the saturated liquid line, where the substance exists entirely as liquid at pressures above the saturation pressure
T-v Diagram (Temperature-Specific Volume)
The T-v diagram is similar to the P-v diagram but plots temperature against specific volume. This projection is particularly useful for understanding processes that occur at constant pressure, as isobars (lines of constant pressure) appear as curves on this diagram.
The T-v diagram shares many features with the P-v diagram but offers different insights:
- Vapor Dome: Similar to the P-v diagram but oriented differently
- Critical Point: The apex of the vapor dome where liquid and vapor properties converge
- Isobars: Curved lines representing constant pressure, which are particularly useful for analyzing constant-pressure processes
- Isotherms: Horizontal lines in the single-phase regions representing constant temperature
P-T Diagram (Pressure-Temperature)
The P-T diagram, also known as the phase diagram, plots pressure against temperature and is especially useful for understanding phase transitions and the conditions under which different phases exist.
The P-T diagram reveals several important characteristics:
- Fusion Curve: The line separating solid and liquid phases, representing the conditions for melting and freezing
- Vaporization Curve: The line separating liquid and vapor phases, representing the conditions for boiling and condensation
- Sublimation Curve: The line separating solid and vapor phases, representing the conditions for sublimation and deposition
- Triple Point: The unique point where all three phases (solid, liquid, and vapor) can coexist in equilibrium
- Critical Point: The endpoint of the vaporization curve, beyond which the distinction between liquid and vapor phases disappears
- Solid Region: The area below the fusion and sublimation curves where the substance exists entirely as a solid
- Liquid Region: The area between the fusion and vaporization curves where the substance exists entirely as a liquid
- Vapor Region: The area below the vaporization and sublimation curves where the substance exists entirely as a vapor
The Three-Dimensional P-v-T Surface
The complete P-v-T surface is a three-dimensional representation that encompasses all the information contained in the two-dimensional projections. This surface provides the most comprehensive view of a substance’s thermodynamic behavior and reveals relationships that are not immediately apparent from the individual projections.
Understanding the Surface Geometry
The P-v-T surface has a complex geometry that varies depending on the specific substance being considered. However, certain general features are common to all pure substances:
- Two-Phase Surfaces: Regions where two phases coexist, forming surfaces rather than lines as seen in two-dimensional projections
- Single-Phase Regions: Volumes where the substance exists entirely in one phase (solid, liquid, or vapor)
- Critical Point: A specific point on the surface where the properties of saturated liquid and saturated vapor become identical
- Triple Line: A line (rather than a point as in 2D projections) where all three phases can coexist
Shape for Substances that Contract on Freezing
Most substances contract when they freeze, meaning the solid phase is denser than the liquid phase. For these substances, the P-v-T surface has characteristic features:
- Fusion Surface: Slopes slightly backward, indicating that pressure must be increased to maintain equilibrium as temperature decreases during freezing
- Vaporization Surface: Extends from the triple line to the critical point, with the familiar dome shape when projected onto P-v or T-v planes
- Sublimation Surface: Connects the solid and vapor regions directly, bypassing the liquid phase
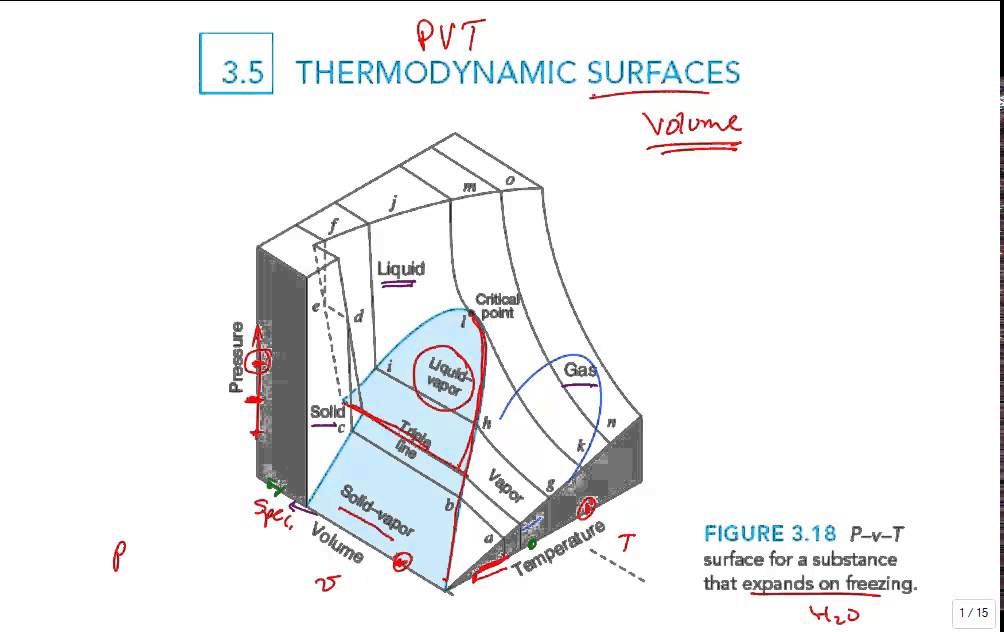
Shape for Substances that Expand on Freezing
Water is the most notable example of a substance that expands upon freezing. For such substances, the P-v-T surface has distinctive characteristics:
- Fusion Surface: Slopes forward, indicating that pressure must be decreased to maintain equilibrium as temperature decreases during freezing
- Unusual Behavior: Ice can melt under pressure, which explains why ice skates work by creating a thin layer of water under the blade
- Geological Implications: This behavior affects geological processes and the behavior of water in natural systems
Identifying Phase Regions on the 3D Model
The three-dimensional surface clearly delineates different phase regions:
- Solid Region: A volume where the substance exists entirely as a solid, characterized by a crystalline structure and strong intermolecular forces
- Liquid Region: A volume where the substance exists entirely as a liquid, with molecules that are close together but able to move past one another
- Vapor Region: A volume where the substance exists entirely as a vapor, with molecules that are far apart and move freely
- Two-Phase Regions: Surfaces where two phases coexist in equilibrium, with the relative amounts of each phase determined by the specific location on the surface
- Triple Line: A line where all three phases can coexist, with only one degree of freedom (moving along the line maintains equilibrium)
Mathematical Representation and Equations of State
The P-v-T surface is mathematically described by an equation of state that relates pressure, specific volume, and temperature. For real substances, this relationship is complex and often requires empirical or semi-empirical equations.
Ideal Gas Law
For ideal gases, the equation of state is simple and well-known:
Where:
- P is the absolute pressure
- v is the specific volume
- R is the specific gas constant
- T is the absolute temperature
The ideal gas law represents a simple surface in P-v-T space, but it is only accurate for gases at low pressures and high temperatures relative to their critical points.
Real Gas Equations of State
For real gases and substances near their saturation regions, more complex equations of state are required:
- Van der Waals Equation: Pv = RT/(v-b) – a/v²
- Redlich-Kwong Equation: P = RT/(v-b) – a/(v(v+b)√T)
- Soave-Redlich-Kwong Equation: P = RT/(v-b) – aα(T)/(v(v+b))
- Peng-Robinson Equation: P = RT/(v-b) – aα(T)/(v(v+b)+b(v-b))
These equations attempt to account for the finite volume of molecules and the intermolecular forces that cause deviations from ideal gas behavior.
Tabular and Graphical Representations
For engineering applications, thermodynamic properties are often represented in tabular or graphical form rather than through analytical equations:
- Steam Tables: Comprehensive tables of water and steam properties over a wide range of temperatures and pressures
- Property Diagrams: Graphical representations that allow interpolation between tabulated values
- Computerized Databases: Digital representations that allow for precise calculations and complex thermodynamic analyses
Applications in Engineering Practice
Understanding the P-v-T surface has numerous practical applications in thermal engineering and power systems:
Power Plant Design
In steam power plants, engineers use P-v-T relationships to:
- Optimize the Rankine cycle by selecting appropriate operating pressures and temperatures
- Design heat exchangers that operate efficiently across different regions of the P-v-T surface
- Prevent equipment damage by avoiding conditions that could lead to water hammer or other dangerous phenomena
Refrigeration Systems
Refrigeration cycles rely heavily on understanding phase changes represented by the P-v-T surface:
- Selecting appropriate refrigerants based on their P-v-T characteristics
- Designing compressors and condensers to operate efficiently in the two-phase region
- Optimizing system performance by operating near the critical point for certain advanced cycles
Chemical Processing
In chemical processing, the P-v-T surface is crucial for:
- Designing reactors that operate under specific phase conditions
- Optimizing separation processes such as distillation
- Ensuring safety by avoiding conditions that could lead to phase explosions or other hazardous phenomena
Critical Phenomena and Supercritical Fluids
Near the critical point, substances exhibit unique behaviors that have important practical implications:
Critical Point Characteristics
At the critical point, the properties of saturated liquid and saturated vapor become identical:
- Critical Temperature (T_c): The highest temperature at which a substance can exist as a liquid, regardless of pressure
- Critical Pressure (P_c): The pressure required to liquefy a gas at its critical temperature
- Critical Specific Volume (v_c): The specific volume at the critical point
Supercritical Fluids
Above the critical point, the distinction between liquid and vapor phases disappears, and the substance exists as a supercritical fluid with unique properties:
- Density: Can be varied over a wide range by adjusting pressure and temperature
- Viscosity: Generally lower than liquids but higher than gases
- Diffusivity: Higher than liquids, allowing for rapid mass transfer
- Solvent Properties: Can be tuned to dissolve specific substances
These properties make supercritical fluids valuable in applications such as:
- Supercritical CO₂ extraction in food and pharmaceutical industries
- Supercritical water oxidation for waste treatment
- Enhanced oil recovery in petroleum engineering
Experimental Determination and Measurement
The P-v-T surface is determined experimentally through careful measurement of substance properties under various conditions:
Measurement Techniques
Various techniques are used to map the P-v-T surface:
- Bomb Calorimetry: For measuring properties at high pressures and temperatures
- Constant Volume Gas Thermometry: For precise temperature measurements
- Acoustic Methods: Using sound speed measurements to determine thermodynamic properties
- Optical Methods: Using refractive index measurements to determine density
Standard Reference Data
National standards organizations maintain reference data for important substances:
- NIST Chemistry WebBook: Comprehensive database of thermodynamic properties
- IAPWS Standards: International standards for water and steam properties
- REFPROP Software: NIST reference fluid thermodynamic and transport properties database
Advanced Thermodynamic Concepts
The P-v-T surface also illustrates more advanced thermodynamic concepts:
Phase Rule
Gibbs’ phase rule relates the number of degrees of freedom to the number of phases and components:
Where:
- F is the number of degrees of freedom
- C is the number of components
- P is the number of phases
For a pure substance (C = 1):
- In a single phase region (P = 1): F = 2 (both P and T can be varied independently)
- Along a phase boundary (P = 2): F = 1 (only one intensive property can be varied independently)
- At the triple point (P = 3): F = 0 (no intensive properties can be varied)
Thermodynamic Surfaces and Property Relations
The P-v-T surface is just one of several thermodynamic surfaces that can be constructed:
- Internal Energy Surface: u = u(P, v, T)
- Enthalpy Surface: h = h(P, v, T)
- Entropy Surface: s = s(P, v, T)
- Helmholtz Free Energy Surface: f = f(P, v, T)
- Gibbs Free Energy Surface: g = g(P, v, T)
These surfaces are related through fundamental thermodynamic relationships and provide complete information about the substance’s behavior.
Conclusion
The P-V-T surface in thermodynamics represents one of the most comprehensive and insightful tools for understanding the behavior of pure substances. By providing a complete three-dimensional representation of all possible equilibrium states, it encompasses the information contained in the familiar two-dimensional phase diagrams while revealing additional relationships and behaviors that are not apparent from projections alone.
The surface clearly illustrates fundamental concepts such as phase transitions, critical phenomena, and the conditions for phase equilibrium. Its mathematical representation through equations of state forms the foundation for quantitative analysis in thermal engineering and power systems design.
In engineering practice, understanding the P-v-T surface is crucial for the design and optimization of numerous systems, from steam power plants to refrigeration cycles to chemical processing equipment. The ability to visualize how substances behave under different conditions allows engineers to select appropriate operating parameters, avoid dangerous conditions, and optimize system performance.
The study of critical phenomena and supercritical fluids, as revealed by the P-v-T surface, has opened up entirely new areas of application in fields ranging from food processing to environmental remediation. The unique properties of supercritical fluids offer opportunities for innovative processes that would be impossible with conventional liquids or gases.
As engineering systems become more sophisticated and operate under more extreme conditions, the fundamental understanding provided by the P-v-T surface becomes increasingly important. Modern computational tools and databases have made it easier than ever to access and utilize this information, but the underlying physical principles remain unchanged.
Future developments in materials science and thermodynamics will likely reveal new aspects of substance behavior and potentially identify new regions of the P-v-T surface with unique properties. However, the basic framework provided by the P-v-T surface will continue to serve as the foundation for understanding and predicting the behavior of pure substances under all conditions.
Engineers and scientists working in thermal engineering and related fields should develop a deep understanding of the P-v-T surface and its implications, as this knowledge forms the basis for many of the analytical and design tools they will use throughout their careers. The ability to visualize and interpret the relationships represented by this surface is an essential skill for anyone working with thermodynamic systems.
The P-v-T surface exemplifies the power of thermodynamics to provide a unified framework for understanding the behavior of matter under all conditions. By studying this surface and the phenomena it represents, we gain insights that extend far beyond the classroom and into virtually every aspect of modern engineering practice.